Search in scripts for "VOLUME BAR"
Buy Sell Signal & IchimokuThe script totally based on technical analysis. Indication of "Buy" will appear once the conditions are matched. Please don't follow "Buy" indication if it appear at top of chart.
Yellow candle is a pre-alert for any momentum coming together with increasing of price.
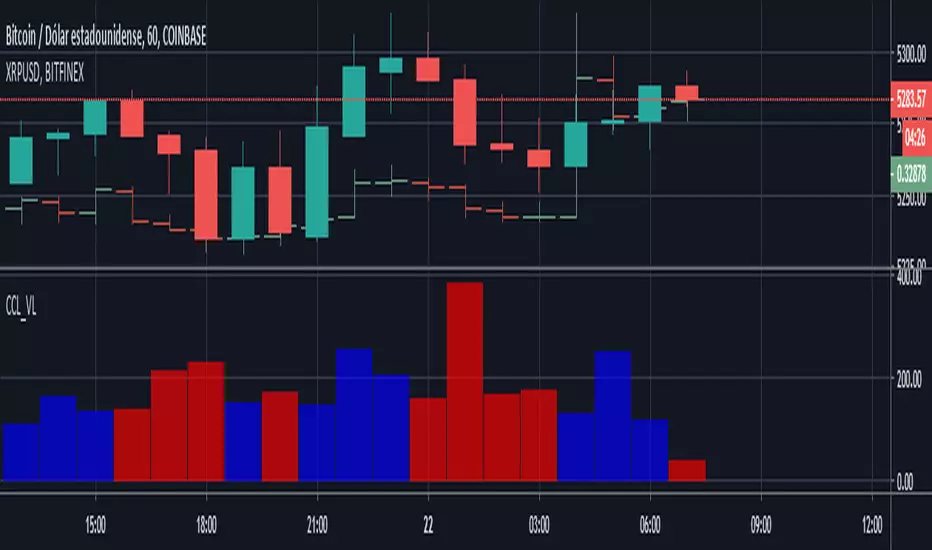
Yellow circle at volume bar is to show that the momentum was there.
Orange line is support & resistance.

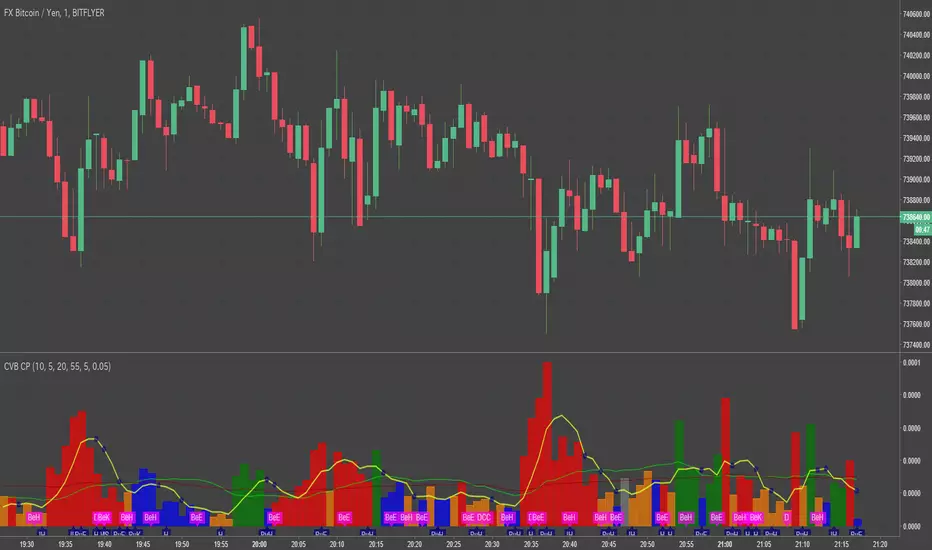
BB & TillsonT3 & MultiWMAbollinger band, tillsonT3 and When you want to open multiple WMA. Coloured Volume Bar as bonus


UltraTrendsFuschia is pivot down, yellow is pivot up, up is confirmed up, down is confirmed down, green is uptrend, red is downtrend, gray is no trend.
I recommend pairing this with:
